Not a single breath of clean air for Dhaka residents in Nov
DailySun || Shining BD
The residents of Dhaka city do not get to breathe clean air even for a single day in November due to a high level of air pollution.
Of the 30 days in the last month, the air quality was ‘very 'unhealthy’ on 13 days, ‘unhealthy’ on 12 days, ‘cautionary’ on 4 days, and ‘moderate’ on 1 day.
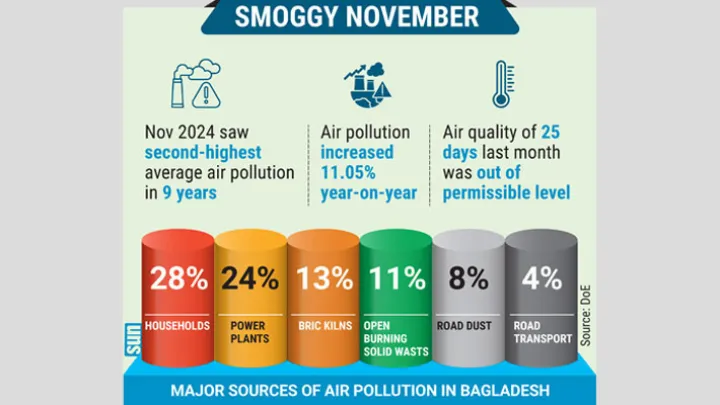
The air quality index (AQI) of November 2024 increased by 11.05% compared to the index of November 2023, according to a monthly statistical analysis of the Center for Atmospheric Pollution Studies (CAPS) of the Department of Environmental Science at Stamford University.
The November 2024 AQI was 10.37% higher than the average value of November over the past 8 years.
This year, November ranked second in terms of average air pollution over the past nine years, said Prof Dr Ahmad Kamruzzaman Majumder, chairman of Stamford University's Department of Environment and CAPS.
According to the data, the air quality of 25 out of 30 days in November was out of the permissible level.
Over the past nine years, the AQI for November in Dhaka was recorded as 169 in 2016, 178 in 2017, 197 in 2018, 159 in 2019, 163 in 2020, 194.8 in 2021, 176 in 2022, and 175.6 in 2023.
In November 2024, the AQI has risen compared to 2023, reaching 195.
However, air quality was less polluted in November this year than in 2018 (197).
Analysing the 270 days of November collected by CAPS from 2016 to 2024—9 years—it was seen that out of the total 270 days of November in the last 9 years, 64 days were ‘extremely unhealthy,’ 138 days were ‘unhealthy,’ and 40 days were ‘cautionary.’
Long traffic jams brought on by poor traffic management also contribute to rising vehicular pollution, said the CAPS chairman adding that no individuals or institutions in the city are effectively reducing air pollution.
An AQI between 151 and 200 is considered ‘unhealthy,’ while 201-300 is ‘very unhealthy,’ and 301-400 is considered ‘extremely unhealthy,’ posing severe health risks to residents.
In Bangladesh, the AQI is based on five criteria for pollutants: particulate matter (PM10 and PM2.5), NO2, CO, SO2, and ozone (O3).
Air pollution in Bangladesh varies by season
During the dry months (November to March), concentrations of PM. across Bangladesh are 2 to 3 times higher than the annual average, while they are 2.5 times lower during the wet months (May to October).
The Greater Dhaka Area (GDA) also experiences significant seasonal variations consistent with other parts of the country (Figure 2.3).
Three stations in Dhaka city show similar PM2.5 concentrations, indicating relatively little spatial variation at the city scale. Locations near Dhaka district, such as Gazipur and Narayanganj, show similar concentrations.
Cumilla, located 100 kilometres away from Dhaka city, shows relatively lower concentrations compared to locations within the GDA.
Major sources of air pollution
Source apportionment studies using the Greenhouse Gas and Air Pollution Interactions and Synergies (GAINS) model provide a first look at the contributions of individual sources to the annual average PM2.5 in Bangladesh (Lima et al. 2023).
The model estimates that the population of the GDA was exposed to an annual average of PM2.5 of 84 µg/m³ in 2020.
Overall, emission sources within the GDA (figure 2.4) account for 56% of the population-weighted annual mean PM235 exposure (or 47 µg/m³), while 15.9% originates in other regions of Bangladesh, nearly 21% from other countries, and 7.1% from natural sources (soil dust).
According to the latest study, the largest share (28%) can be traced to households (mainly biomass cook stoves), followed by power plants (24%), brick kilns (13%), and open burning of municipal solid waste (11%).
Road dust accounts for about 8%, and exhaust emissions from road transport for 4% (mainly from heavy-duty diesel vehicles).
More than 40% of all PPM emissions in the GDA originated from the residential sector, mainly from solid fuel used for cooking.
Brick kilns contributed 25% of total SO2 but only 3% of primary PM2. 5 emissions, while mobile sources (including non-road mobile machinery) accounted for 15% of all NOx emissions.
Shining BD

